The market can be chaotic and confusing. There are so many factors that can affect both the market and the individual trades we place. As day traders, it’s our job to make our approach as formulaic as possible. The more formulaic our approach, the simpler decision making becomes. This is the true art of trading.
We take a seemingly infinite amount of data, filter it down, and use those findings to trigger trading decisions. Human emotions and decision making patterns can often rob of us of the clarity we need to thrive in the markets. The ultimate goal is to have a robotic approach to trading. That’s why we use a lot of the technological tools at our disposal. Your stock scanner doesn’t have to think twice about which stocks to show. It simply provides results based on a set of criteria. The process is fluid and efficient. Now, imagine if you can apply that same approach to your trading.
Choosing which trades to place is it not always easy. We can never know with certainty what the market will do next. That said, we can account for all outcomes and attempt to adopt a binary thought process. This approach relies heavily on having a proper trade plan.
Breaking Down the Trade Plan
While you may have 1000 thoughts rushing through your head before you place a trade, the decision is actually quite simple. You either enter a position or you don’t. To simplify this dilemma, you need quantitative criteria that dictate whether or not a position should be initiated.
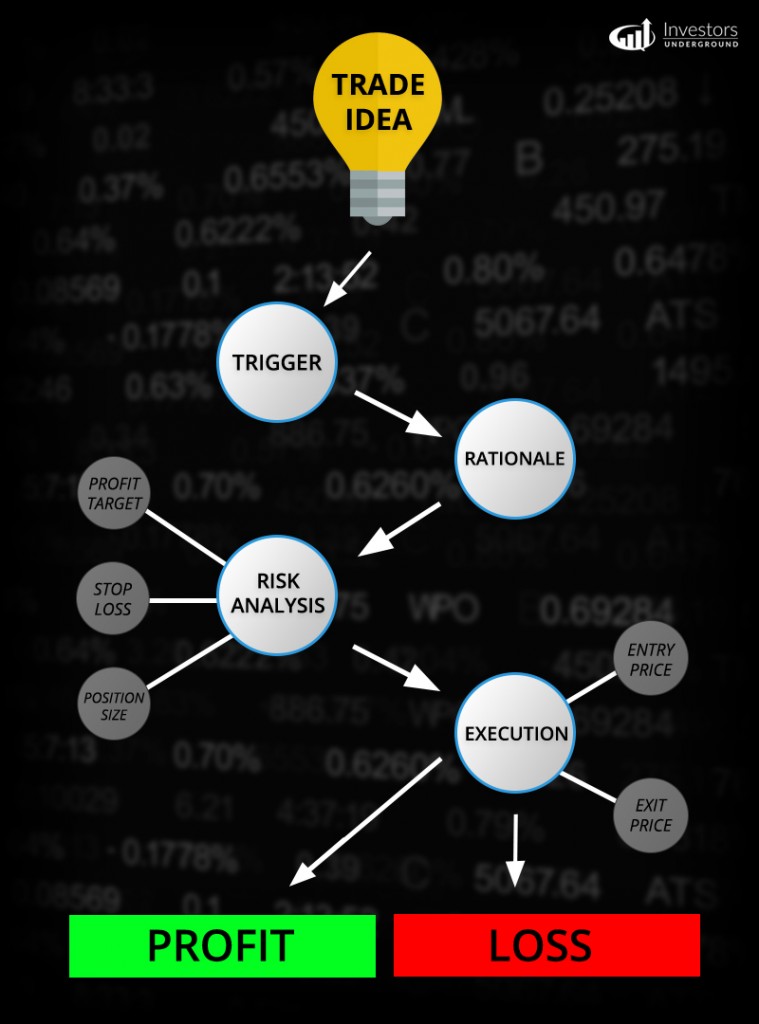
The Trigger
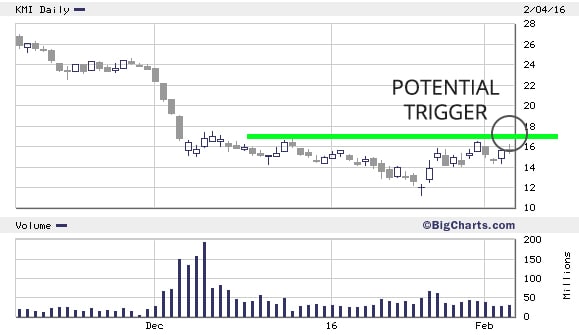
With regards to a trade plan, the “trigger” is what initially catches your interest in a stock. This trigger is generally marked by an event or some significant change within the stock or underlying company. Common triggers may include:
- Press Releases
- Earnings
- Technical Patterns
- Market Strength/Weakness
The trigger gets you interested in the stock. The next step is deciding whether or not there is actually a trade in play.
The Rationale
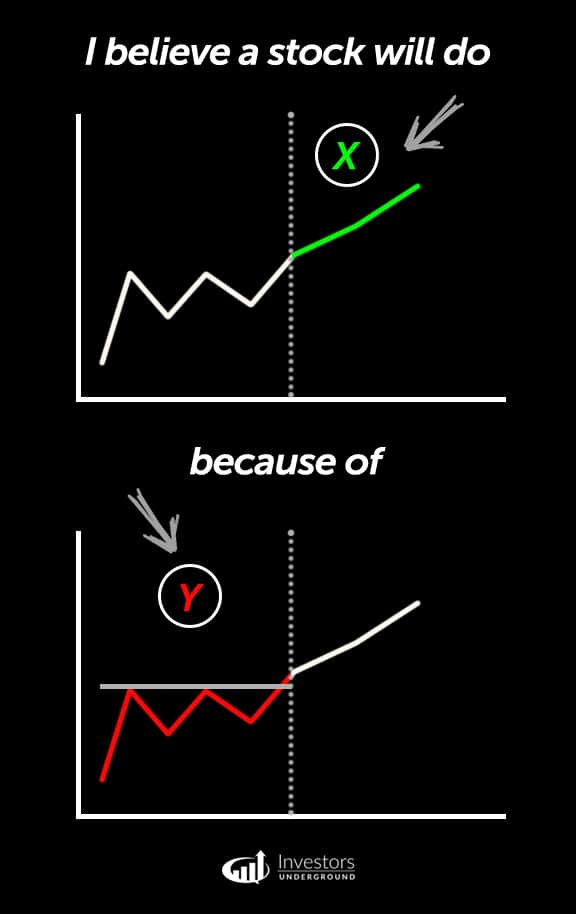
Everything we do in trading is purposeful. We do not make guesses and we do not rely on luck. Instead, we use the data available to us to form a trade hypothesis. “I believe this stock will do X because of Y.” For example, “I believe this stock will go up in price because they released positive earnings.
It’s important to be as thorough as you possibly can. Evaluate all of the data and don’t allow yourself to become biased. Your rationale can make or break your trade. For example, if you think a stock price is overextended but you fail to account for a crowded trade, you may find yourself stuck in a short squeeze.
In short, gather as much data as possible and account for multiple scenarios. This leads to the importance of risk analysis.
Risk Analysis
Risk analysis and mitigation is what truly separates a good trade from a bad one. You can come up with the perfect plan and things still may go wrong as a new factor is thrown into the mix. This is why you need to be well aware of the risks involved in your trade.
Target Profit Range
The first thing you need to do is set a target profit range. If the trade moves in your favor, at what price are you going to exit your position? If you fail to plan your profit range target, you may succumb to greed. Remember, the goal is to eliminate emotions and replace them with solid criteria. Your profit target range may be a price or a trigger. For example, you may plan to take profits when a stock starts to speed up relative to prior price action or as it nears prior resistance to play safe. In most cases trading involves not only scaling into a trade but also scaling out to maximize the potential but also minimize emotions as the trade develops.
Needless to say, your profit target should not be arbitrary. There should be solid rationale behind it.
Stop Loss
Obviously, you will want a trade to go in your favor, but you need to have a plan in case it goes against you. Whether or not you set a hard stop loss is up to you, but you should plan for when you want to cut losses.
This may be a:
- Stock price (i.e. when the stock hits $15)
- A max dollar loss (i.e. when you’re down $500)
- A trigger (i.e. when the stock breaks support or has failed follow through momentum and trend begins to reverse & fade off)
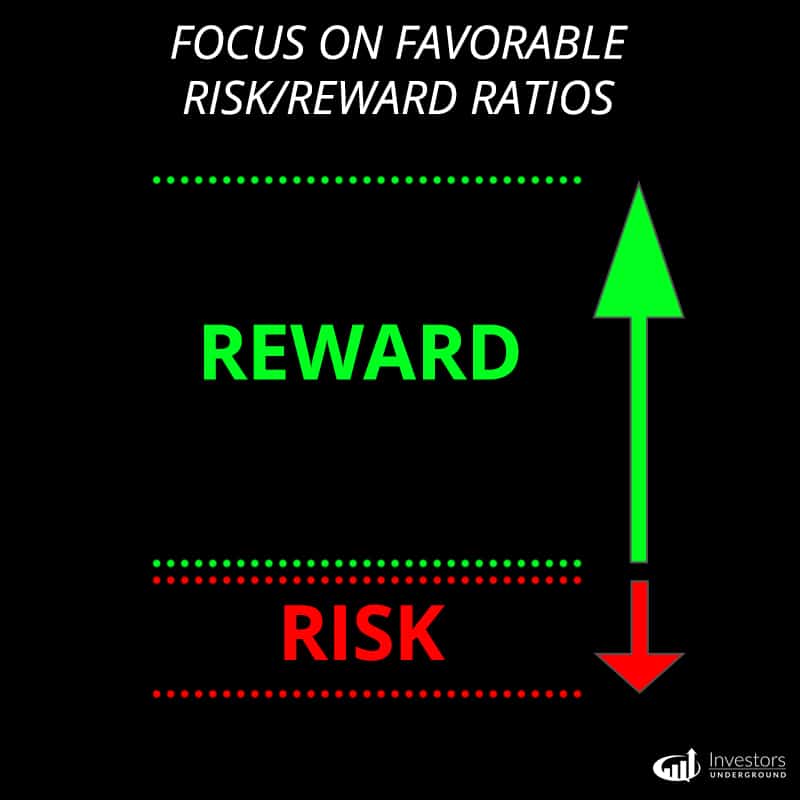
When deciding a stop loss, you should account for your profit target range. This will allow you to generate a favorable risk/reward ratio. For example, if you enter a stock at $16 and have a profit target of $18-20, you may decide to cut losses if the stock drops to $15. This gives you a nice risk/reward ratio of approximately 1:3. You can use that ratio to choose your position sizing.
Position Sizing
Your position sizing will translate the risk/reward ratio into a dollar amount. For example, if your risk/reward ratio is 1:3 ($1:$3), a position size of 1000 shares makes your potential risk $1000 and potential reward $3000.
This ensures that you’re taking trades that appear to provide a better potential profit than risk. Many times traders jump in a name don’t realize they are risking $1 share to make potentially $1 a share until after they are already in the stock. It’s important to always find trades that provide a better potential reward than risk.
It can be helpful to decide how much you are willing to lose on a trade and reverse the math. For example, if you are willing to lose a maximum of $500 on a trade with a risk/reward ratio of 1:3, you should not purchase more than 500 shares ($500 risk/$1500 reward).
With this approach, you have much more control over your capital. If you follow your plan properly, you are fully in control of the trade. This leads to the importance of execution.
Trade Execution
As we know, theory and execution are not always identical. Even if you’ve created the perfect plan, you still need to execute it before the results are tangible. Luckily, you’ve done the proper planning. Now, you just need to buy and sell the stock.
Entry Price
Your entry price is the price at which you buy (or short sell) the stock. You may choose to buy or short sell your position in one trade or scale in.
Your entry price should allow you to execute the plan you already set forth. Account for your risk/reward ratio and place the trade.
If your plan becomes difficult to execute, pivot. If your ideal risk/reward ratio is no longer practical, consider lowering your position size. If the stock ramps before your order gets filled, reevaluate your trade idea. Keep in mind that being patient and waiting for proper entries reduces the emotions you’ll experience in the trade.
Exit Price
You’ve already planned your exit price potential when you did your risk analysis. Now, all you have to do is stick to the plan. Take profits or cut losses as you planned.
A successful trade is not always characterized by profitability; it’s characterized by proper execution of the initial plan.
An Example Setup (The ABCD Pattern)
This “anatomy of a perfect trade” is something we apply to most setups. One of the popular setups we use at Investors Underground is the ABCD pattern (discussed in depth here).
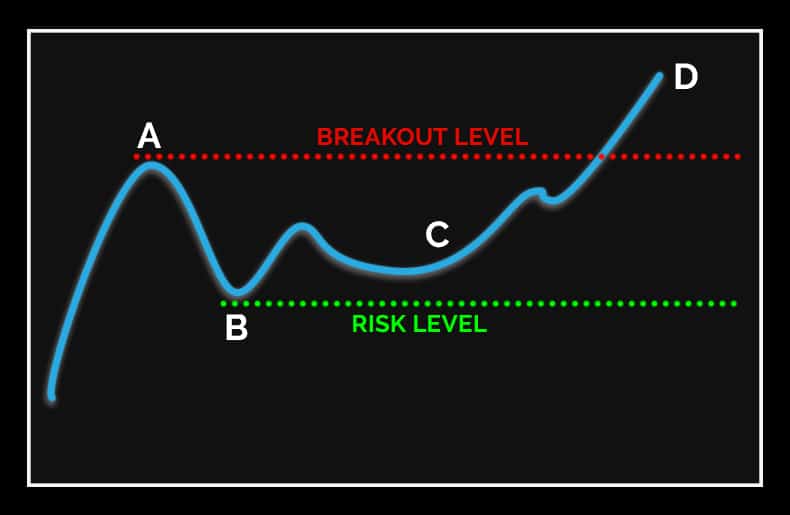
Here is what the pattern looks like:
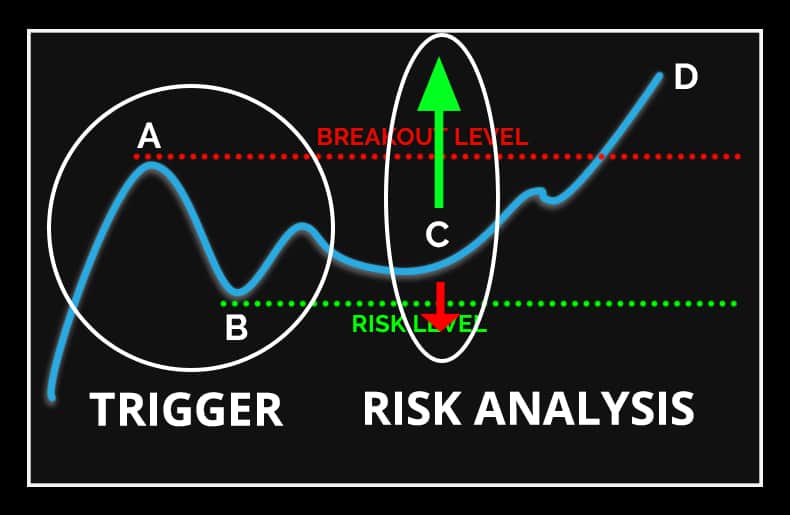
Here is a breakdown of the trade plan:
The Trigger: Points A and B give us a trigger. This is when we start planning a trade.
The Rationale: We’ve used this pattern over and over again so we have a good understanding of how it may play out. Nonetheless, we account for all situations.
Risk Analysis: We base our risk at “B” and plan to take profits at point “D.” This leaves us with a favorable reward ratio of 1:3+.
The Execution: Our entry price is planned around point “C” and our exit price is planned around point “D”
This trade plan is completely robotic because there are no unknown factors. We know exactly when to buy and sell and we know the risk involved. Of course, the market can throw surprises our way, but for the most part, this provides us with the criteria we need to make smart trading decisions.
Wrapping it Up
The main focus of this approach is to demystify some of the elements of trading. You may choose to modify the approach to fit your style, but the ultimate goal should be to replace emotions & unknown variables with quantifiable criteria and probabilities. This will help you to narrow down the potential outcomes and make robotic trading decisions.
Although you can never fully eliminate all risk, you can avoid surprises. Think of it like rolling dice. If you roll a dice and predict a number, you know you have a 1 in 6 chance of being correct. You’re never surprised by the outcome of the roll because you’ve accounted for all scenarios. Imagine rolling a dice when you have no idea what is on any side; it’s a recipe for disaster. Focus on visualizing and planning for all scenarios in trading, and you can significantly improve the efficiency of your strategy.






This was a great recap for new traders like me, thank you so much and keep them coming please!
Thanks for the time and effort. Keep them coming please!!
Thanks for reading and thanks for commenting!
TripleV was here learning. Thank you, Nate!
Very educational material. Thank you for showing us the ins and outs of trading. It makes a big difference to achieve success and financial freedom. Thanks a lot!!!!!
Another best! ‘Risk Management’ demystified. ‘Trade planning’ nailed. Both these concepts had remain fuzzy and theoretical. But the execution of this tutorial has been exceptional. I am picking up these referral links from the ‘Learn to Day trade’ series and ‘Beginners guides’ series. It would be great to link those free resources directly to the paid course material as it works very well together as a reinforcement.
Thanks Guys.
Good one, Nathan. Thanks for taking the time.
Great read Nate.
What an excellent, well written guide. Great read. Thank you Nate!
Thank You Nate . I love when I’m learning something new everyday in a different way. I hope that makes sense.
Great info. Soaking it up
Thank you for the information. As a newbie to the stock market, your articles help a lot.
Great read