It’s no secret that momentum traders prefer technical analysis to fundamental analysis.
Try to give a trader the fundamental case for a company and you’ll get shot down faster than you can say, “free cash flow.”
It’s not that technical traders don’t believe in the impact of fundamentals – they just don’t have the time to do an in-depth analysis of every stock they trade. Just think about it – if you had to research the financials, management team, and growth rates for every company you traded, you’d probably miss the bulk of your trades.
Traders use technical analysis as a shortcut.
In a way, technical analysis summarizes the results of fundamental analysis. The end result of fundamental analysis is a buy, sell, or hold decision. If the research paints a positive picture of the company, you buy. If it is negative, you sell or avoid the trade. All of these fundamentally-fueled decisions are shown on a stock chart, which is one of the reasons why technical analysis can be used as a shortcut. The technicals may not paint a 100% accurate picture of the fundamentals, but technical analysis is far more efficient for traders who trade 10-20 tickers per week.
Of course, traders can incorporate both forms of analysis into their research and there are a few fundamental factors every trader should be aware of. Certain high-impact fundamental factors like news and earnings do not show up on a stock chart, so it’s important that technical traders have a basic understanding of a stock’s fundamentals before entering a trade.
Technical Analysis vs. Fundamental Analysis
Before we move forward, we should be clear about the basic difference between technical analysis and fundamental analysis.
Technical analysis is the analysis of a stock’s price and volume data. This methodology assumes that the majority of fundamental factors are reflected in a stock’s price.
Fundamental analysis is the analysis of the company itself. This may include the company structure, financial statements, growth, competition, and more.
Let’s get to the fundamental checklist.
The Fundamental Checklist
When you enter a position, you are buying shares in a company. As a trader, it doesn’t always feel that way since you’re simply taking advantage of short-term price momentum, however reality remains the same. Your position is susceptible to fundamental factors, and it’s important to be aware of these factors so you can avoid any nasty surprises.
This doesn’t mean that you need to dig through SEC filings, read industry research reports, and scrutinize a company’s financials. Using this fundamental checklist, you can do a quick fundamental analysis that will complement your existing technical strategy..
Here are a few things to look for.
Float
A stock’s “float” is the number of freely traded shares on the market.
Traders should always be aware of a stock’s float because it accounts for the “supply” part of the “supply/demand” equation that controls the market.
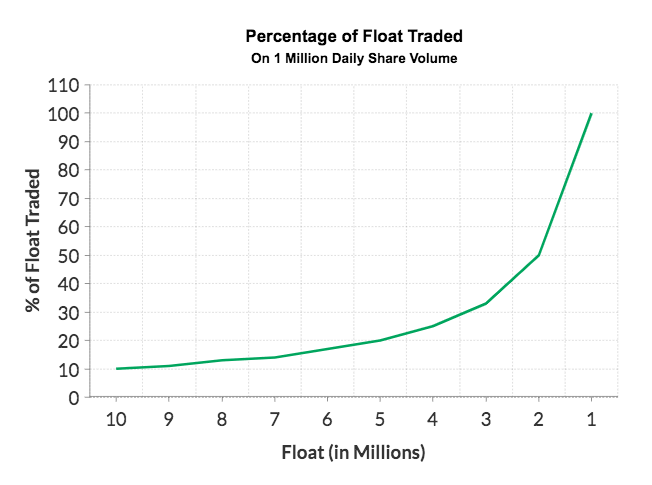
Stocks with lower floats are far more volatile than stocks with higher floats. For example, assume two stocks both have daily volume of 1,000,000 shares. If Stock A has a float of 2,000,000 and Stock B has a float of 20,000,000, Stock A is likely to experience higher volatility on the same share volume. Because supply (float) is lower, less demand (daily volume) is required to move the stock. Shares pass hands more frequently which can affect the stock’s trading behavior.
Go back and check some of the craziest breakouts from the past year. Chances are, a lot of them are low float stocks.
Short Interest
A stock’s short interest is the number of shares that are currently being held short (not covered). To put this in perspective, you could compare a stock’s short interest to its float to get the short percent of float. For example, if a stock has a float of 1,000,000 shares and a short interest of 500,000 shares, the short percent of float is 50% (500,000/1,000,000).
As you know, stock prices fluctuate relative to supply and demand. When buyers overpower sellers, a stock’s price goes up (and vice versa). Short positions can interfere with this supply/demand equation, especially when short sellers are pressured to cover their positions. Covering short positions has the same effect as initiating a long position. A short seller covering 10,000 shares will have the same impact as a long-biased trader buying 10,000 shares.
When the short percent of float is relatively low, it won’t have an impact on trading behavior. Short sellers can short and cover as they please.
When the short percent of float is high, short sellers may be forced to liquidate their positions prematurely. For example, if 50% of a stock’s float is held short, this means that whenever the stock price goes up, 50% of position-holders (short sellers) are losing money and may be likely to cut losses. Cutting losses entails covering a short position and, when a large group of short sellers cover simultaneously, it can trigger a short squeeze that artificially increases the price of a stock.
Here’s an example of a famous short squeeze, where a biotech stock ran from $0.44 to over $45:
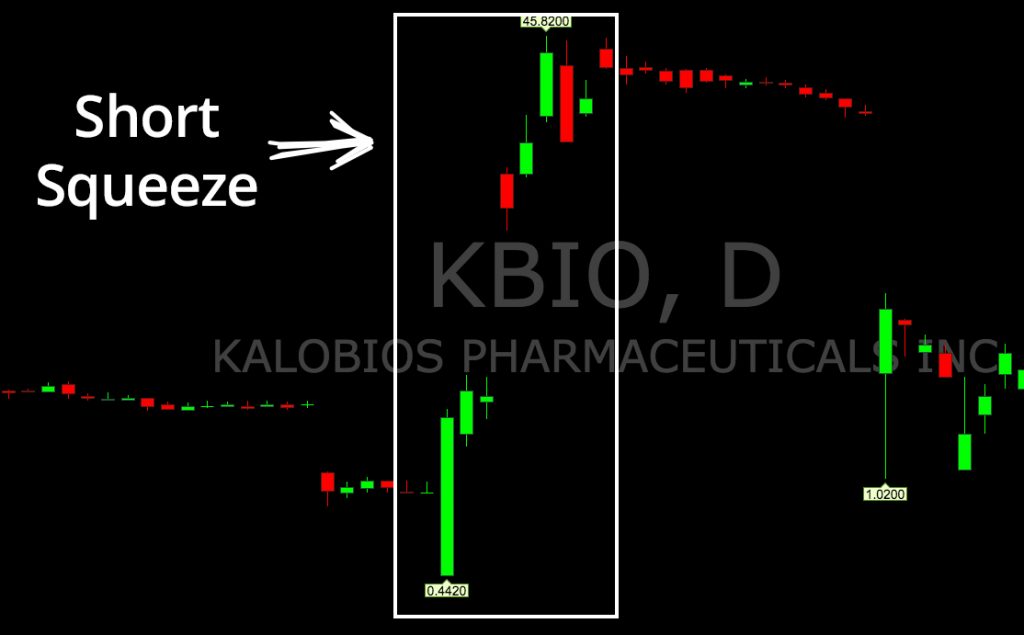
Sometimes, the short thesis is rational but the trade becomes crowded.
Be aware of the short interest before you enter a position so you can better understand the stock’s price action.
Financials
Financial analysis may seem counterintuitive to technical trading, but the two can coexist harmoniously. Technical traders can benefit from having a basic understanding of a company’s financial standing. You don’t need to know a company inside and out, but you should be able to determine if the company is generally good, bad, or somewhere in between. Saying a stock is “up too much” or “down too much” doesn’t really mean anything if you don’t understand the underlying business.
Here are some things to consider:
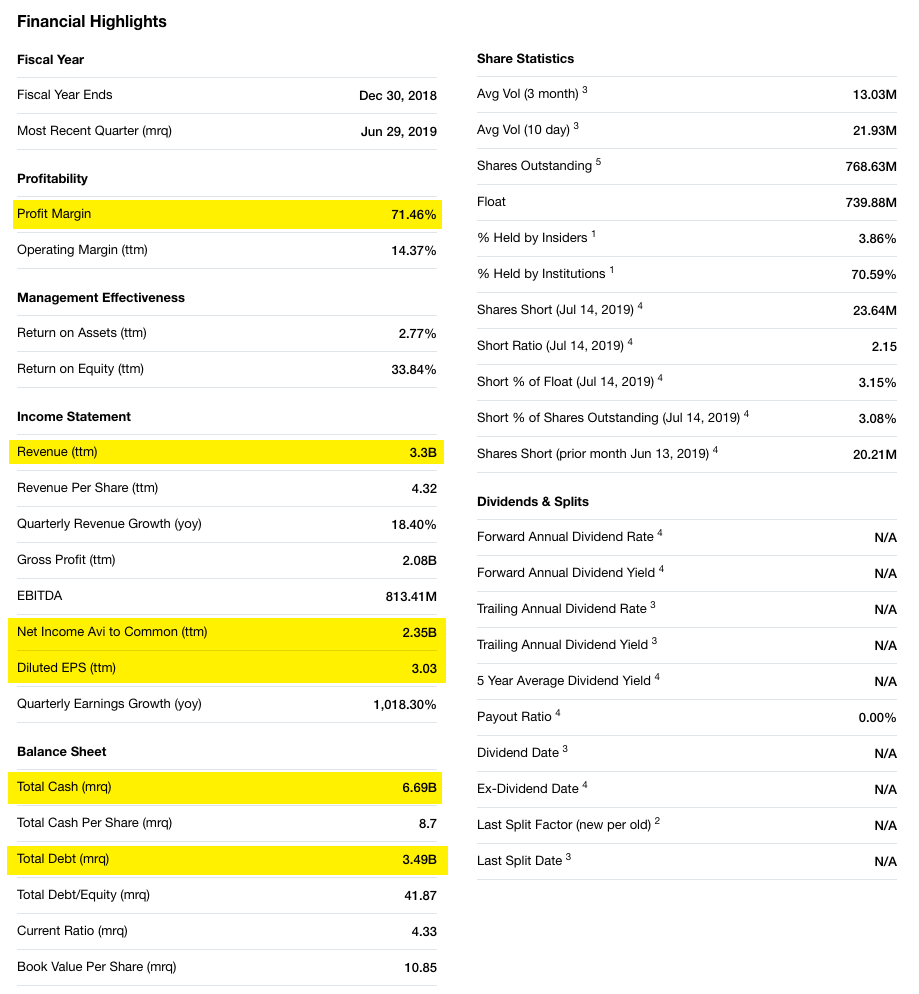
- Does the company make any money? How much?
- Is the company profitable? What is the EPS?
- Does the company have debt?
- Does the company have cash?
You can find these statistics listed on most financial websites, and a quick glimpse of these numbers may save you from trouble down the road.
For example, if you know a company is low on cash, you may expect them to release an offering after a short-term price breakout.
Having a basic understanding of what you are trading can help protect you from surprises.
Earnings Reports
A lot of traders ask me how I play earnings. The answer is, “I don’t.”
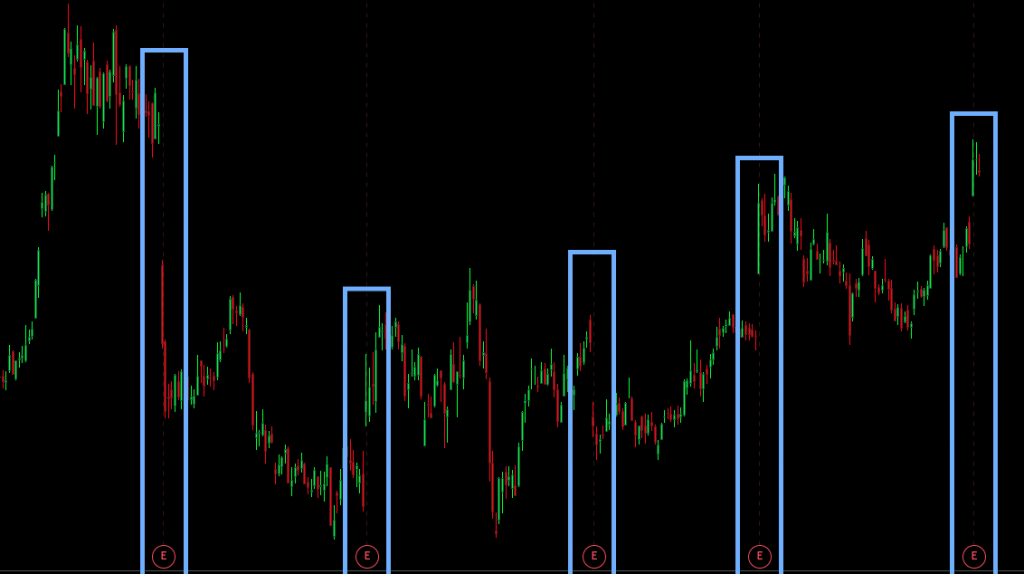
Earnings are a coin toss and if you get stuck holding through earnings, you may be in for a nasty surprise.
You could find the PERFECT technical setup only to watch it fail due to a bad earnings report.
If you’re going to hold positions overnight, make sure you’re aware of the companies’ earnings dates.
News
Company news can explain the “why” behind a stock’s price action.
Companies put out press releases all of the time and, while you can’t predict news, you can anticipate certain types of stories.
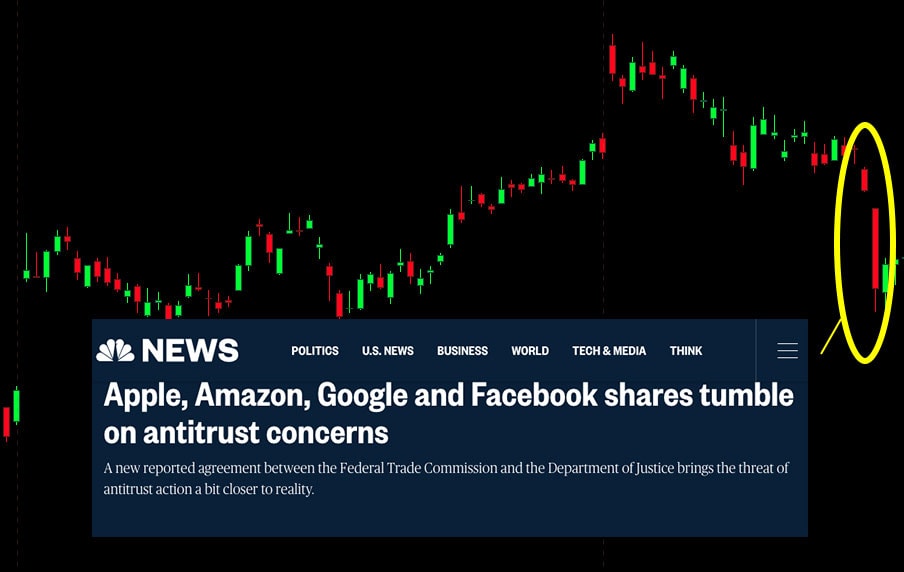
Take Facebook ($FB) for example. On June 2, 2019, the stock closed at $177.47. On June 3, the stock gapped down and hit a low of $161.01 after reports of the FTC threatening antitrust action. While this news wasn’t 100% predictable, it certainly didn’t come as a surprise since the company had been under intense scrutiny in the preceding months. A diligent trader would be aware of this risk before entering a position.
News analysis can also help you better predict future price movement. For example, a fluff PR may give a stock a boost, but the stock is likely to give back its gains once the market realizes the true impact of the news.
Offerings and Warrants
When a company goes public, they make an offering of shares in order to raise money. Most people are familiar with IPO’s (initial public offerings), but few understand how companies raise additional capital after their IPOs.
When a company has a secondary offering, they release more shares to the public (often at a discounted rate). There are a few different types of offerings and most of them are bad news.
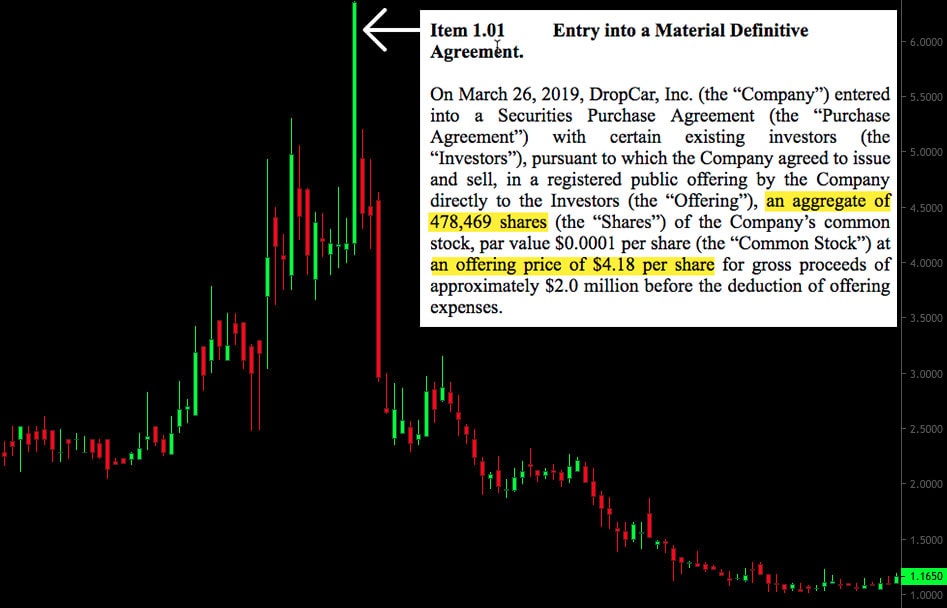
Since offerings introduce new shares, they increase the supply of a stock, which can make it more difficult for the stock to gain upward momentum. For example, a company that sees its share price run from $2 to $6 may use the momentum as an opportunity to file a secondary offering at $4/share. The offering allows the company to raise much-needed capital, but it almost certainly spells the end of the breakout.
It’s also important to be aware of shelf offerings. Whereas secondary offerings give companies the right to facilitate a one-off sale of securities, shelf offerings give companies the right to continuously sell a fixed amount of shares over a period of time. These shares are considered to be on the “shelf” until the company decides to sell them.
Here’s an example for comparison:
- Secondary offering: Company Sells 500,000 shares at $10/share
- Shelf offering: Company is licensed to sell $10,000,000 in new shares over a 3-year period
The shelf registration doesn’t require companies to sell all of the shares, but it gives them the ability to. Generally, these shares can be sold for up to three years from the effective date on the registration filing.
It’s important to be aware of shelf registrations because they may allude to future dilution. You can check for S-3 Filings on the SEC website to see if a company has any open shelf offerings.
Economic News
Last but not least, you should be aware of national and global economic events that may impact the stock market. Since the majority of stocks follow the market, economic news can have a major impact on your trades. You should be aware of the broader market factors that impact the stocks you trade every day.
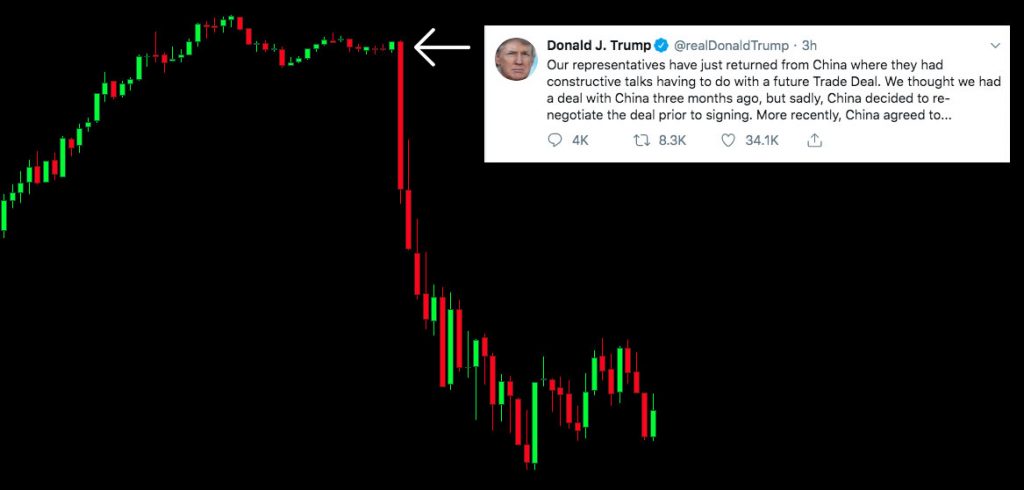
In recent months, we’ve seen a lot of stock market volatility related to the US-China trade deal. A simple headline can push the S&P 500 up or down 1-2% in a few hours.
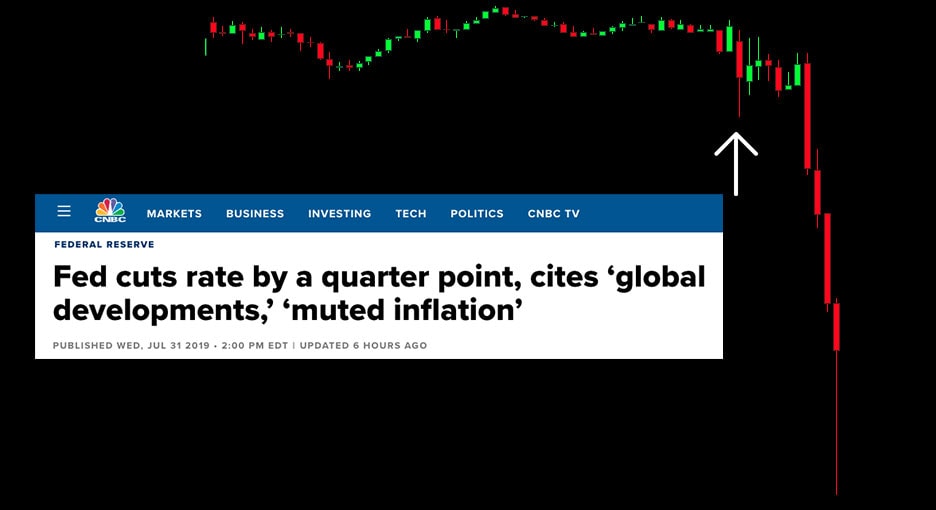
This type of volatility isn’t limited to trade negotiations. We see similar volatility around FOMC meetings as the fed announces updates to the federal funds interest rates.
What do you Look For?
Analyzing the fundamental factors above can help you become a more well-rounded trade. Taking a few minutes to account for these factors may save you from a hefty loss.
Anything else you would add to the list? Leave a comment below!







Poor beginner, thanks you
Cleared up some questions I had.
I read information and took notes. Very helpful information.
Thank you, sincerely
great article guys , thanks a lot !
Thanks for sharing this information with us. I think you guys one of the best traders on the market
Thanks again
Great info for another beginner!
thank you I dunno how far I could cope with this valuable info u provided but sure will try thanks once again
Great info ! Thk for sharing
always clear and always helpful: so glad i decided to join this incredible community led by Nate!
Thanks this is a great post!
I know short interest isn’t always up-to-date on certain sites or available to view with some brokers. What’s the best place you would suggest looking to find the most accurate short interest?
Thanks,
Melissa
Thank you good information!
Solid! I’d just add from TT:
1) Don’t trade out of boredom
2) Don’t trade to get back or make up for a previous loss
3) Rather than focusing on making $X amount per day, focus on trading well
4) Don’t add to losing positions
5) Trade well and profits follow
wow this is awesome bro
Great points for those that may trade blindly!
wonderful
Crazy good points, clear, concise and well explained!! One of the best articles for beginners I have read so far. Learned a lot from this one (almost an aha moment jeje ) 😉
👍thank you!