Day Trading Encyclopedia
Technical Indicators Stochastics
Stochastic Oscillator

Stochastic Oscillator Explained
The stochastic oscillator is a momentum indicator that can be used the time entry and exits based on the overbought or oversold condition of the underlying financial instrument. Originally developed by Dr. George Lane in the 1950s, the concept was to compare the current price relative to the price range for a segment of time. The indicator has three inputs based on the following formulas:
%K = (Price – L5)/(H5-L5)
%D = 100 x ((K1 + K2 + K3)/3)
%D Slow = D1 + D2 + D3/3
*H is high and L is low of 5 periods
*K represents %K value for days 1-3 making
%D an average of 3 periods of %K
*D Slow is the 3 period moving average of %D
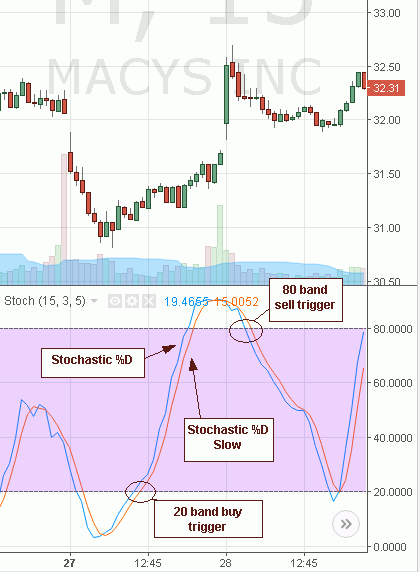
Traders have to select a value for each of the three inputs. A common input selection is %K = 15, %D = 3 and %D Slow = 5. This produces three oscillators %K, %D and %D Slow. Since %D and %D Slow are derivatives of %K, most traders opt to just use the %D and %D Slow as the two main stochastic oscillators, a lead and laggard.
The stochastic oscillators are measuring on a scale from zero to 100, which are called bands. The 20-band and 80-band are defaulting place markers that indicate the momentum status. When the stochastics (both the %D and %D Slow) fall under the 20-band, the momentum is considered oversold. When the stochastics both rise above the 80-band, the momentum is considered overbought, similar to an car’s tachometer red-lining. As an oversold stock can continue to become more oversold, the underlying price can continue to sell-off when the stochastic remain under the 20- band, despite being oversold. A buy trigger only forms when the stochastics are able to both cross back up through the 20-band. Like a rubber band that has been stretched and finally let go on one side, the price tends to snap back up with the stochastic 20-band crossover. On the flipside, an 80-band stochastic crossover down forms a sell/short-sell trigger.
Problems with Stochastics
Stochastics measure the momentum, not the range of the price movement. This is a very important distinction. As one full stochastic oscillation from 20-band to 80-band may result in a $1.50 price move, the inverse oscillation back down from the 80-band to the 20-band may only reap a + $0.50 price move. Any idea why? This inconsistency is what turned off many followers of stochastic oscillators. The argument that the oscillations were often too choppy and the range of the oscillations were not proportionate to the price moves of the underlying stock (or financial trading instrument).
The answer to why the stochastic oscillators don’t consistency parallel the underlying range of price movement is that they measure momentum, not price. The other logical explanation is that the oscillations are more robust when aligned with the current price trend, in most cases. An up trending stock will generate a larger price move on buy triggers and shallower price move on sell triggers. A down trending stock will generate a larger move on sell triggers and a shallower move on buy triggers. Stochastics like all indicators work best when used in combination with other indicators to generate a cumulative effect. Moving averages and candlestick charts are often used in conjunction with stochastics.
