
Why do stock prices fluctuate and how can we predict these fluctuations?
This question should be at the core of any effective trading strategy.
Traders aim to take positions when they believe they have the ability to predict future price action with high levels of certainty.
There’s an ongoing debate as to whether or not this is even possible. On one side, you have those that believe in the Efficient Market Hypothesis, a controversial theory that states you cannot beat the market because all factors are already accounted for in a stock’s price. On the other hand, you have ambitious traders and investors who religiously chase alpha.
As traders, we clearly fall into the latter group. If we didn’t believe you could beat the market, we wouldn’t waste our time trading.
Of course, being able to beat the market requires an ability to see opportunities that others don’t, and spotting these opportunities requires a strong understanding of why stock prices fluctuate. Traders are constantly watching stock prices fluctuate but they don’t always stop to think about why.
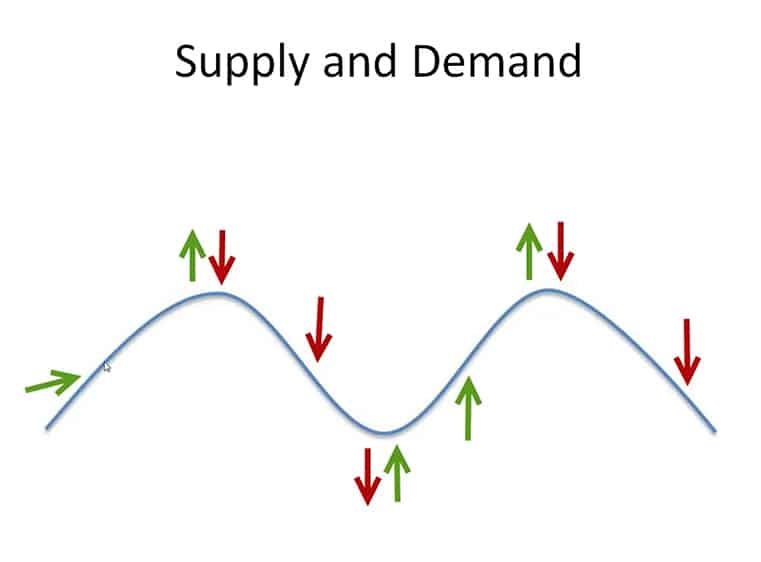
From a pure market mechanics perspective, stock prices fluctuate relative to supply and demand levels. When demand exceeds supply, a stock price goes up (and vice versa). Market mechanics explain the “how,” which is great for hindsight analysis, but we need to understand the “why” if we want to accurately predict future price movement.
We don’t have time to break down every single component of price variation, so we’ll approach this topic from a broader perspective.
Stocks move for a variety of fundamental, technical, and economic factors, but the factors themselves are not as important as the perception of these factors. Basically, stocks are only worth what people believe they are worth.
Take a popular large cap stock like Apple (AAPL) for example. Over the past year, AAPL hit a low of $142 and a high of $233, meaning it traded within a ~$100 range. That’s a lot of volatility for one of the biggest companies in the world. So, what is AAPL truly worth? Within that $100 trading range, what was the correct price for AAPL? Of course, that’s a tricky question….
Before we discuss valuation models, let’s start by clarifying why value matters.
Why Does Value Matter?
The term “value” has a different connotation in the investing world. It brings to mind value investors like Warren Buffett and Benjamin Graham.
A differentiation needs to be made between market value and intrinsic value. Intrinsic value is a subjective term for estimating a company’s true fundamental value, whereas market value is simply the price at which a stock trades. For our purposes, market value provides a more objective measurement.

Day traders only care about price action, so it’s only appropriate to let “value” be represented by the stock’s price. After all, the stock’s price is symbolic of the value it’s been assigned by the market.
Traders don’t focus on a stock’s value in the traditional sense but they still account for it in their analyses. It would be impossible not to. While you may not think about whether a company is fundamentally overvalued or undervalued, you should be thinking about whether you are buying/selling a stock at a good price.
Present Value vs. Future Value
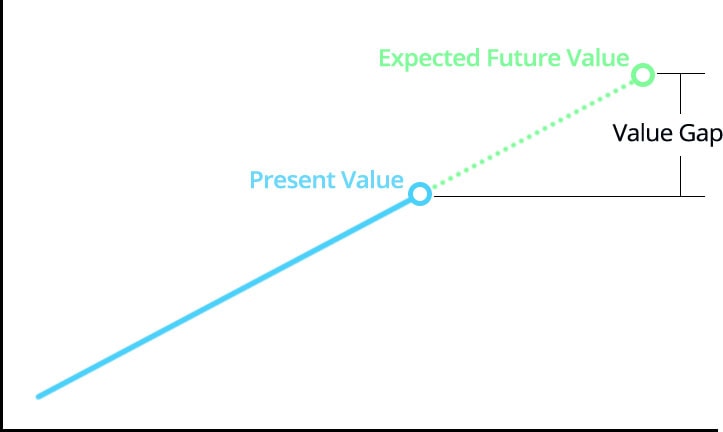
Every successful investment/trading strategy is built around finding a gap between present value and future value. The methods for finding these gaps vary greatly, but the underlying objective is universal.
You buy a stock when you think it will be worth more in the future and you sell/short when you expect it to be worth less in the future. This doesn’t mean you’re doing an in-depth analysis of a company’s financial situation. It simply means you’re making predictions about a stock’s future market value relative to its current price.
In order to make these predictions accurately, you need to be able to understand why stock prices fluctuate. As chaotic and irrational as the stock market can be, it’s still designed to align market values with intrinsic values.
To begin our analysis, it can be helpful to understand some of the valuation models used to predict fair stock prices.
What is a Stock Worth?
Since the inception of the U.S. stock market, people have been experimenting with stock valuation models. These models incorporate complex calculations and analyses of market data in an attempt to determine the intrinsic value of a stock. Theoretically, if you could put together an accurate valuation model, you would be able to buy undervalued stocks, short overvalued stocks, and beat the market consistently.
Unfortunately, there is no universal valuation model. Many have tried to create effective models, but no one has succeeded in creating a universally-accepted approach to stock valuation. That said, analyzing popular valuation models can help explain how the rest of the market gauges value. At the very least, these models provide some interesting perspectives to anyone who enjoys the analytical side of the market.
Let’s look at a couple.
Dividend Discount Model
The dividend discount model (DDM) attempts to assign a value to a stock based on the value of its future dividends.
To determine the value of dividend paying stocks, you could calculate the lifetime return of all expected dividends in order to figure out a fair value. If future dividends had a present value of $100, the stock would be worth $100.
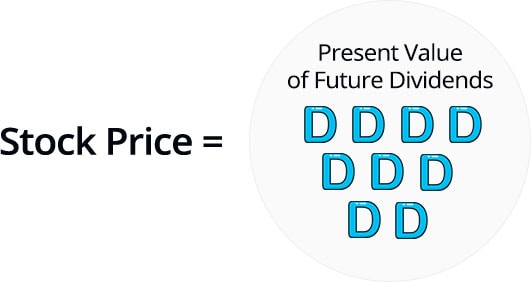
The DDM implies that a stock would be valued at the present value of all future dividends. Of course, all stocks don’t pay dividends, so this model alone isn’t enough to answer the question
Price-to-Earnings Analysis
For stocks that don’t pay dividends, you could attempt to value a company based on its earnings (and earnings potential). The price-to-earnings ratio (P/E) is commonly used to compare a company’s earnings to its stock price.. If a stock is priced at $100 and it has an EPS (earnings per share) of $10, the P/E ratio is 10 ($100 share price/ $10 EPS).
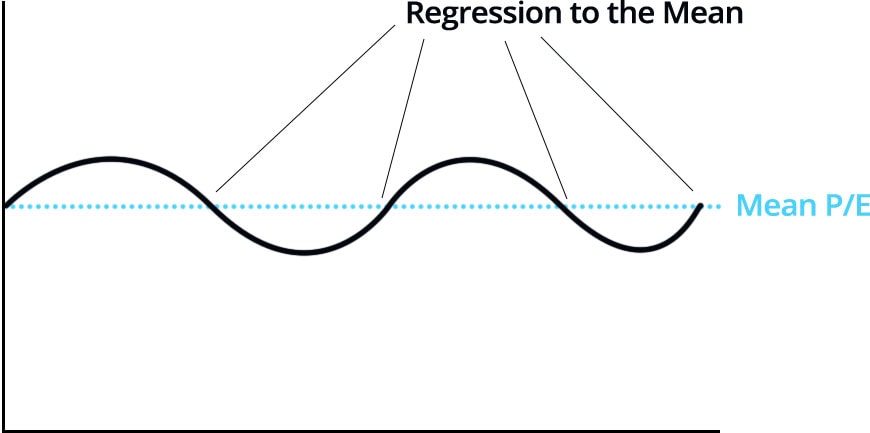
This ratio could be compared to other companies in the industry to determine whether the stock is overvalued or undervalued. If the industry average P/E ratio was 15, and a stock had a P/E ratio of 10, it could be argued that the stock was undervalued.
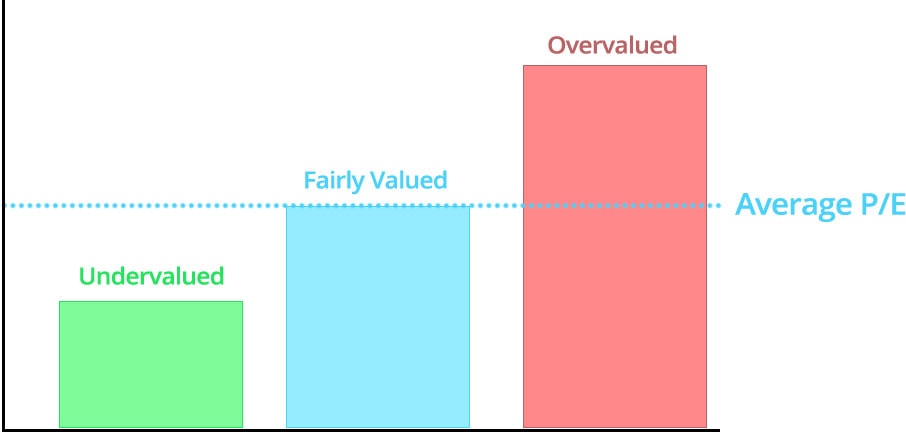
Benjamin Graham famously used this analysis to show that, over time, “undervalued” stocks in the DOW index outperformed “overvalued” stocks as both groups regressed to the mean P/E ratio.
The P/E Analysis and DDM are just two of many valuation models and, while they are still used today, they are not without their flaws. Furthermore, traders care less about the intrinsic value of a stock than they do about the market value.
Market value is determined by – you guessed it – the market. This next “model” provides an interesting framework for gauging market value.
The Keynesian Beauty Contest
For day traders, one of the best valuation models isn’t much of a “model” at all, but more of a perspective. It stems from the methodology of economist John Maynard Keynes who compared stock picking to a beauty contest using the following example:
A newspaper runs a beauty contest in which entrants are asked to choose the six most attractive faces from a group of one hundred photographs. If entrants choose the most popular faces, they win a prize.
A first-level thinker would simply choose the six photographs that they found the most attractive. While this may seem like a decent strategy, beauty is subjective and your personal preferences may not be inline with the masses.
A second-level thinker would choose the six photographs that they believed others would select as the most attractive from the group.
A third-level thinker would think about what the second-level thinker was choosing, and so on.
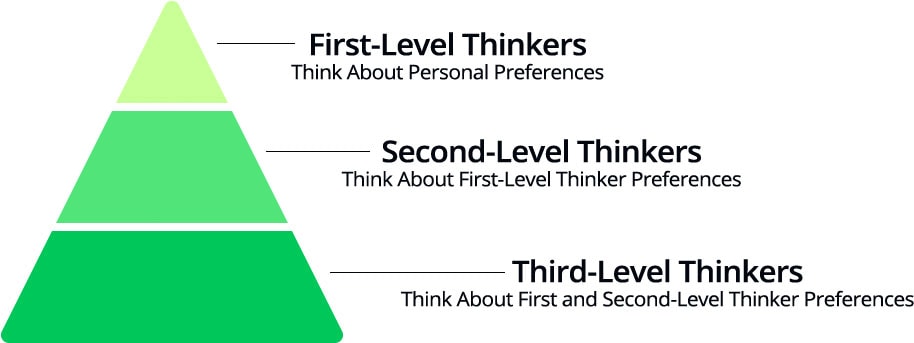
For the sake of simplicity, we’ll be focusing on the first and second-level thinkers.
A first-level stock picker chooses stocks that they like. A second-level thinker chooses stocks that they believe other people will like, thus accounting for a larger percentage of market participants.
The Keynesian beauty contest stresses the importance of perception over reality. While there are many stock valuation models, a stock’s price is still as subjective as attraction.
This basic insight has a few major implications.
Stock Market Perception vs. Reality
Analyzing perception (or market sentiment) forces traders to escape the confines of their own minds so they can enter the minds of other traders. This approach is built around an assessment of market mechanics and psychology instead of personal opinions.
Here are a few of the takeaways.
The Market is Always Right
Should a company that is losing money on $200 million in yearly revenue be valued at over $10 billion?
Trick question – we already know that it’s not the job of a trader to create valuation models. Why? Because it doesn’t matter… We value market sentiment over personal insights.
The example above refers to the IPO of Beyond Meat (BYND) in which short-sellers fought this perceived “irrationality” from the stock’s IPO price of $45/share all the way to a high of $200/share. Rationality mattered less than perception (and market mechanics).
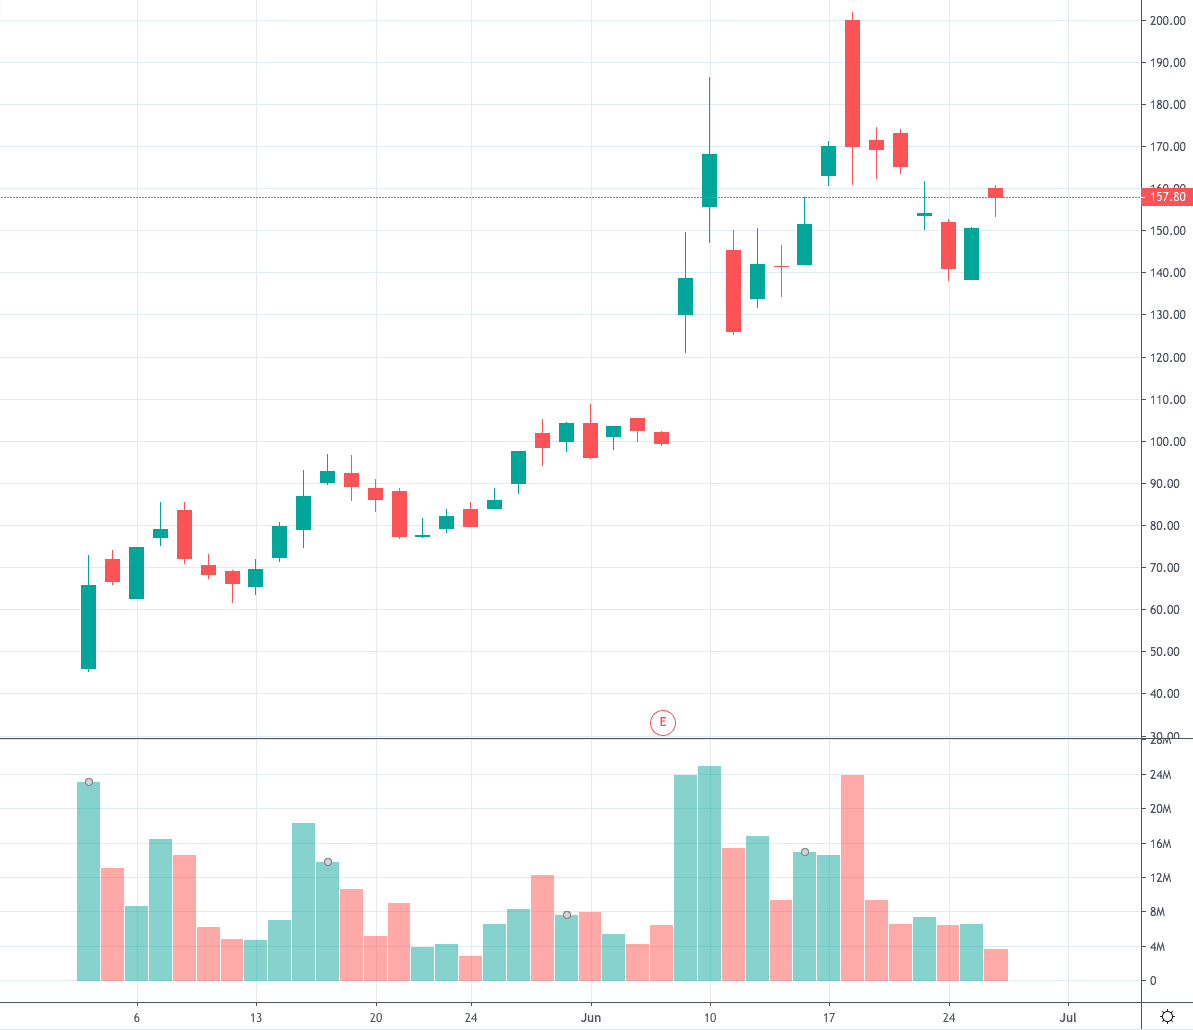
The price action of this move was sending clear signals that nullified any short-term hypothesis rooted in a case for market inefficiency.
Repeat this mantra a few times – the market is always right. Think of this as the trader’s version of the Efficient Market Hypothesis, in which we may not believe that the valuation is right but we agree that the price is right. Fighting price action is a losing battle and as Keynes once stated, “the market can stay irrational longer than you can stay solvent.
This methodology can apply to any situation where you believe a stock should be doing something that it’s not. Here are a few examples:
- These are bad earnings. The stock should go down…
- That news is insignificant. The stock should not react.
- This company is garbage. It should be trading at a fraction of the price.
Fighting price action with supposedly logical arguments can be a recipe for disaster.
This isn’t to say you shouldn’t make price predictions; that’s our job as traders. However, you should not fight the market when your thesis is disproven.
Price Action Talks Loudest
There’s a reason most traders use technical analysis. A stock’s price accounts for a variety of fundamental, economic, and industry-related factors. We could spend hours researching every company we trade OR we could use a stock’s price as a metric to summarize this data.
This concept ties back to one of the guiding principles of our trading strategy – trade the ticker, not the company.
We’re focused on the perception of a company, NOT the reality of the company’s situation. The latter only matters if it’s inline with the public perception. If your analysis leads you to believe a company had great earnings but the market is selling off, you should assign more weight to the sell-off than your own opinion.
A contrarian mentality will only get you so far if you continuously fight the market. Let a stock’s price action do the talking.
Think Like Other Traders
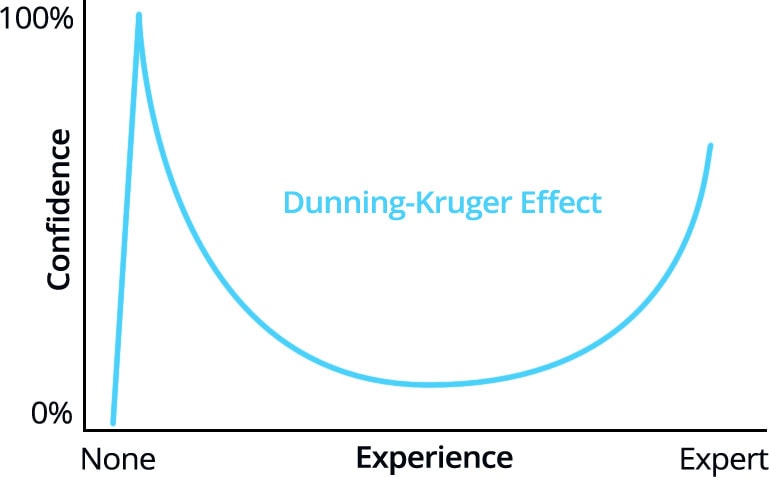
The Dunning-Kruger Effect is a cognitive bias that explains how people are ineffective at estimating their own competence. Most famously, the effect explains how incompetent individuals perceive themselves as more competent than they actually are.
A less discussed finding of this study shows that experts tend to underestimate their competence. You’ve probably experienced this firsthand. If something seems easy to you, you undervalue the skill involved. For example, if you can make a grilled cheese sandwich blindfolded, you may assume everyone else can do the same.
So, how does this relate to stock trading?
First, it shows that beginners tend to overestimate their abilities (something all new traders should be conscious of).
Second, it shows that experienced traders may discount their own competence and assume everyone is seeing what they’re seeing. This ties in to another cognitive bias called the “false-consensus effect,” in which people assume that their views are reflective of the majority. We tend to think that others think like us, and if we’re unaware of this bias, it can skew our trading analyses.
This concept is best illustrated by example.
Assume an OTC company puts out a bogus press release with the headline, “Totally Legit Co. Signs Purchase Agreement With Walmart.” You read the article and notice that the value of the purchase agreement is only $1,000 and the company’s products are only being tested in a few stores.
Your inner pragmatist is quick to dismiss the PR as nonsense without considering how the market will react. If instead you think about how other traders (possibly less diligent) may perceive the news, you may be able to make a trade out of this “bogus PR.”
This type of irrationality doesn’t exist solely in the world of penny stocks. We see this phenomenon time and time again at the highest levels as experts squabble about whether news has already been factored into a stock’s price. Some examples include:
- Global trade deals
- Fed Interest Rates
- Bad earnings that were expected (per previous guidance)
- Nonsense PR’s in a hot sector
Price action IS the reality and, while there is money to be made as irrational moves are corrected, you’re timing needs to be spot on or you will pay the price.
Always focus on how the masses will react – they’re the ones who move the market.
Perception Explains the “Why” Behind Technicals
While we’re discussing the masses, let’s have a look at the best indicator for mass sentiment: price action.
When traders first learn technical analysis, they’re likely to think about why it works. Why do support/resistance levels work? Why is VWAP a significant indicator?
Part of the answer can be explained by perception. When you’re staring at a stock chart, there are thousands of other traders looking at the same exact chart. If you see a support level, these traders see it as well. For example, if you plan to buy a stock when it pulls back to VWAP, there may be thousands of other traders doing the same thing. If this group of traders outnumbers the opposing group (i.e. short at VWAP), you will get the VWAP bounce you expect.
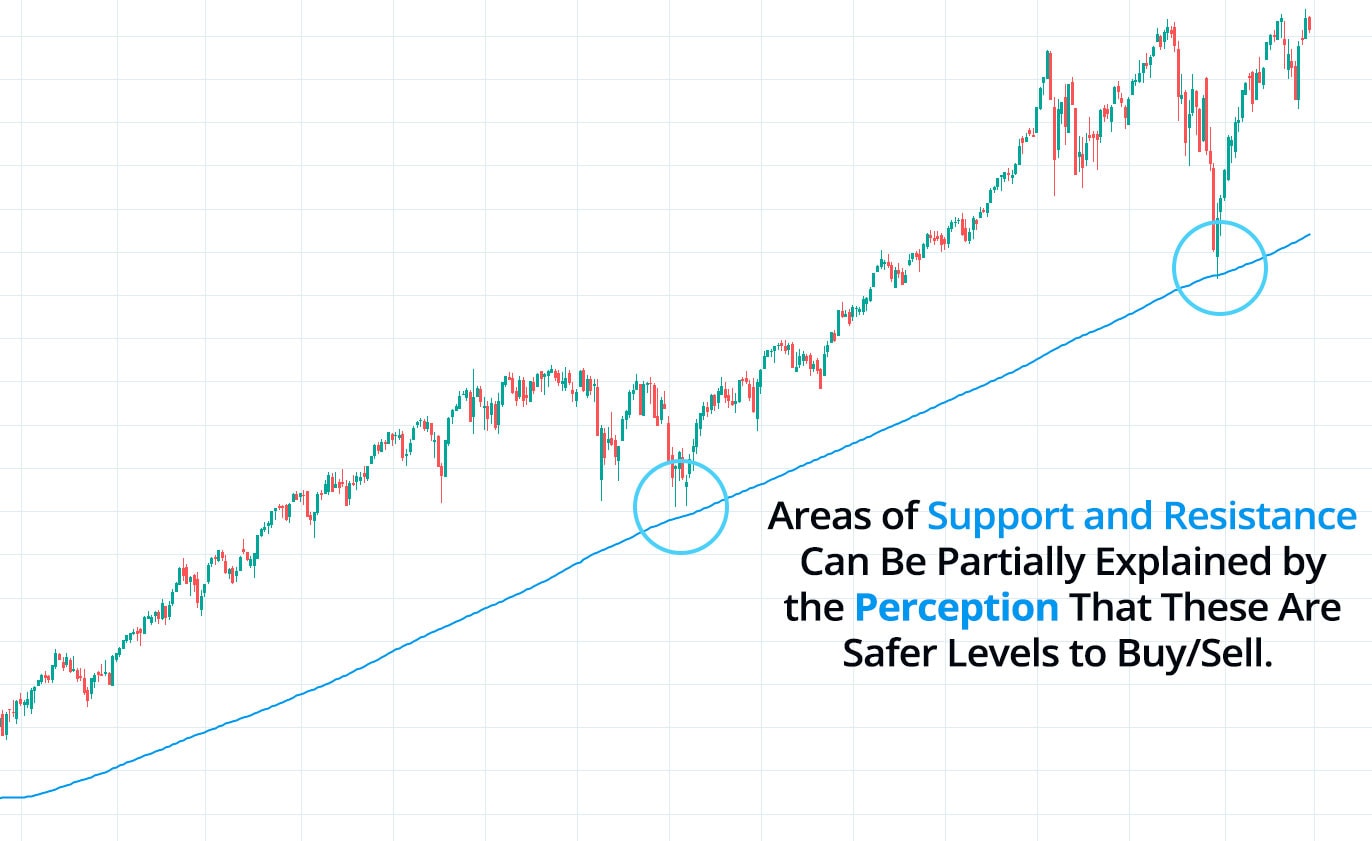
While the “self-fulfilling” component of technical analysis isn’t the sole reason for it’s efficacy, it certainly plays a role.
Start Taking Action
The concept of “perception vs. reality” is pretty simple, yet so many traders ignore it. They get carried away with their own opinions and disregard clear signals.
During the next few days, focus on how perception affects the price action of the stocks you trade. Think about whether you are fighting the market or respecting price action and use these insights to adjust your mindset.


Thank you for continuing to share wisdom.
It’s like learning computer science – first, have to learn lots of series than hand on…mmm I like more of the hands on…thanks
but whats the mean? Vwap? SMAs? EMAs?
Great posts as usual..
Congratulations on lesson 1 of the intermediate course, released this month.
It is a game changer..
The “plan” making a difference and having a bad plan.. Priceless.
These are indicators.
SMA : simple moving averages
EMA : exponential moving averages
VWAP : Volume weighted average price
Simple moving average, exponential moving averege, volume weigehd avereg price
Thanks a lot for another very informative post. There is one part I cannot make the ends meet. I will really appreciate if you could explain this part. Let’s take the VWAP support example, you mentioned the bounce from VWAP level is because there is a huge demand in that area and majority of traders were waiting to get in and that cause the price to bounce and advance from those levels. If this was true then it means majority of traders should make money which we know it’s not true. Or if majority of traders are waiting to short in bounce toward VWAP area then price will drop which indirectly means majority of traders will be right and make money.
Very enjoyable read. Intelligent text with lots of wisdom.
I did this with ENPH and was wondering what happened. I new. And now I see. Thanks.
Really nice one Nate again jam of a post. Talk about value investment by giving an example of Graham ‘father of value investing’ Buffett his student , Kenyan biggest England’s economist and dunning kurger effect. Massive knowledge in this post. Keep up the good work and free post for us trader how aspire to be like you one day.